Guide to the Network Glue network diagram
This article outlines the steps for viewing and understanding the Network Glue network diagram.
Accessing the network diagram
Once you have purchased Network Glue, you will see the Networks Core Asset in the sidebar of each organization.
NOTE If you have customized your sidebar, refer to our Add assets to the Organization Sidebar article.
- Navigate to the organization and click on Networks in the left side menu.

- Click the network name in the list view to show the network diagram for that network.

Understanding the diagram visuals
Device icons
The following table shows the icon for each of the network devices that may appear on the network diagram.
| Icons | Network Device Represented |
|---|---|

|
Router |

|
Switch
|

|
VM or Hyper-V guests
NOTE VMware and Hyper-V hosts will display as a regular device type (usually server, network device, or switch). |

|
Firewall |

|
Server |

|
Computer |

|
Printer |

|
Network Device/Unknown |

|
VoIP |

|
Storage |

|
Security |

|
Modem |

|
Load Balancer |

|
Access Point |
Primary Domain Controller and Backup Domain Controller devices
If you have enabled Active Directory (AD) on your network, you will see Primary Domain Controllers (PDC) and Backup Domain Controllers (BDC) identifiable on your network diagram by a green outline and an AD symbol. This will allow you to quickly identify Domain Controller devices within the overall hybrid or on-premise AD infrastructures.
| Primary Domain Controllers | ||

PDC Virtual Machine |

PDC Server |
PDC Network Device/Unknown |
| Backup Domain Controllers | ||
|
BDC Virtual Machine |
BDC Server |
BDC Network Device/Unknown |
Connections between virtual assets
If you have added VMware host data during the Collector setup, the network diagram will provide visibility into your virtual network connections.
Connections between the following virtual assets are represented by a dotted line:
- Hyper-V hosts and virtual switches/Hyper-V guests
- VMware hosts and VMware guests
Note that if virtual switches, Hyper-V guests or VMware guests are discovered but their connection to a host is not found, then these VMs will not be displayed on the diagram. If a connection is found, then the VMs and its host will be displayed.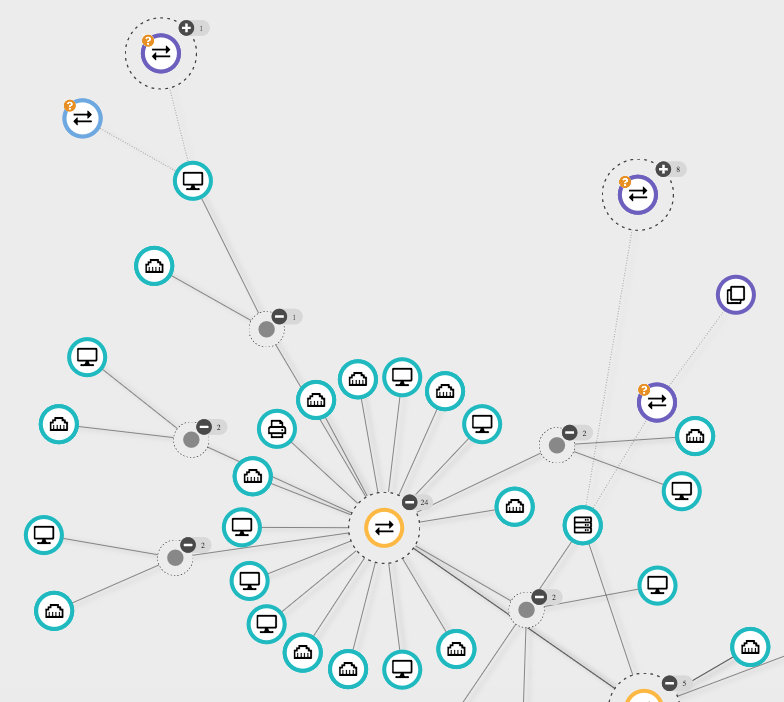
Gray icons
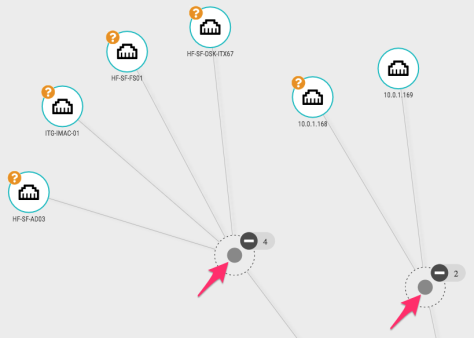
Other than the network device icons, you will also see gray icons on the network diagram. There are two types of gray icons:
- Connection Points: Unmanaged connection/access points (usually wireless access points) that show how devices in a single cluster are related.
- Root Nodes: A single node on each network diagram that collects all the disconnected devices to visually represent connections that the Network Collector was not able to recognize.
These are labeled Root on the diagram.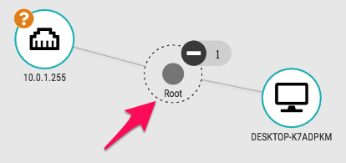
Question marks
On the network diagram, the question mark symbol identifies any devices that are not matched to an IT Glue configuration. If a device is automatically matched, or once you manually match the device (see our Guide to Network Glue device matching KB article), the icon will disappear from the diagram after your next sync.
Kaseya VSA Agent Status
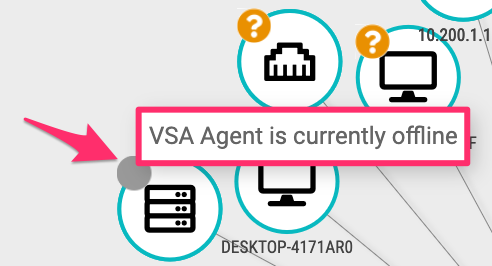
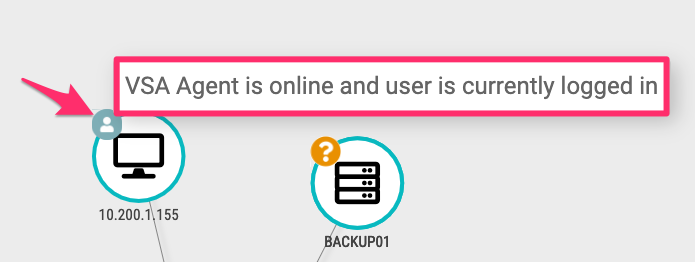
For our partners with active VSA integrations, you can view and filter by agent statuses on your network diagram if your Network Glue devices are matched to IT Glue Configurations and Integrating with VSA 9. On the diagram, you can view the following agent statuses:
| Agent Status | Network Diagram Icon |
|---|---|
| VSA agent is currently online |
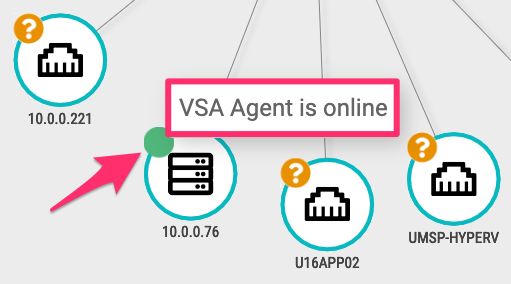
|
| VSA agent is currently offline |
|
| VSA agent online and user is currently logged in |
|
You can also filter your network diagram by searching for one of the above three VSA agent statuses. If the agent status is unavailable, then the network device will not display the VSA agent status icon.
If the Network Glue device is not matched to an IT Glue Configuration synced with Kaseya VSA, then the device will not show any VSA agent status on the diagram. You will not be able to filter for VSA agent status. However, can filter for devices not matched to IT Glue through the "Matched to IT Glue" status.
Unitrends MSP Backup Status
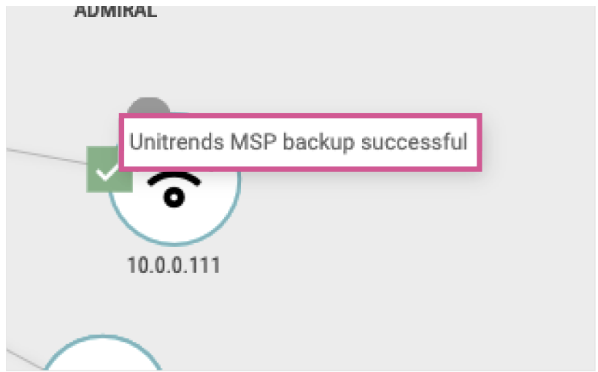
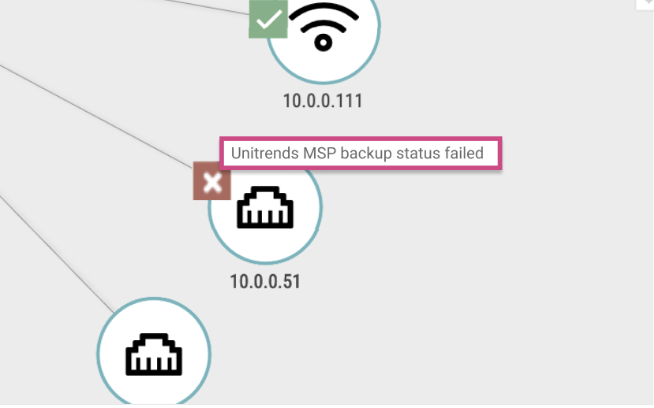
For our partners with active Unitrends MSP integrations, you can view and filter by device backup statuses on your network diagram if your Network Glue devices are matched to IT Glue Configurations and Integrating with Unitrends through UniView. On the diagram, you can view the following agent statuses:
| Agent Status | Network Diagram Icon |
|---|---|
| Unitrends MSP backup status successful |
|
| Unitrends MSP backup status failed |
|
Icon legend
For quick reference to our device types and status icons, click on the Legend at the bottom left of the network diagram.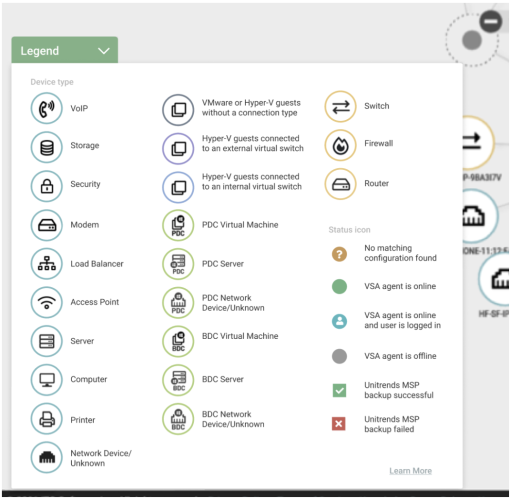
Navigating the network diagram
The table below lists the available functionalities that allow you to navigate the network diagram.
| Button | Function |
|---|---|

|
Zoom in |

|
Zoom out |

|
Opens the device matching page. See our Guide to Network Glue device matching KB article for more details. NOTE You will need Administrator or Manager level access to utilize the device matching page. |

OR
|
Expands/collapses to show or hide all devices on the network diagram. NOTE The expanded view is the default. Click this button to toggle between the expanded and collapsed views. |

|
Groups all devices by type on the network diagram. NOTE Once you apply a new filter, the diagram will ungroup and highlight the devices based on your filter search. |

|
Displays the network diagram in a tree view. |

|
Displays the network diagram in a cluster view. |
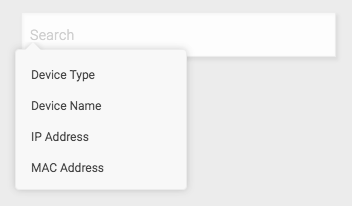
|
Search by device type, device name, IP address, or MAC address. To start matching your devices, refer to Guide to Network Glue device matching. |
Expanding and collapsing icons and roots
When a router, switch, or unmanaged connection point (root) has associated devices on the network diagram, they are shown by default. You can click the minus (-) icon to collapse and hide those devices from view, allowing you to quickly filter through or pinpoint certain parts of the network during troubleshooting. To show the devices again, simply click the (+) icon to expand.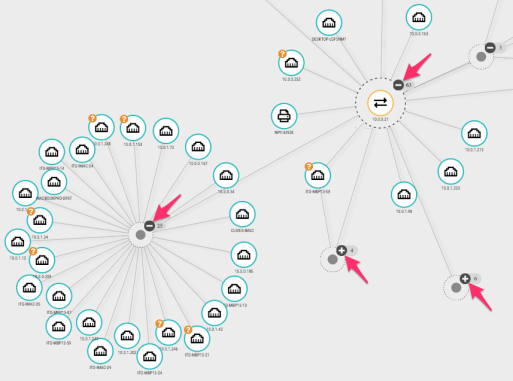
Grouping by devices
In the default view, the network diagram shows all network devices in the expanded view. You can click the Group by button and select Type in the drop-down menu to group together devices of the same type under each parent root. This applies to servers, computers, printers, and network devices. Note that routers and roots cannot be grouped.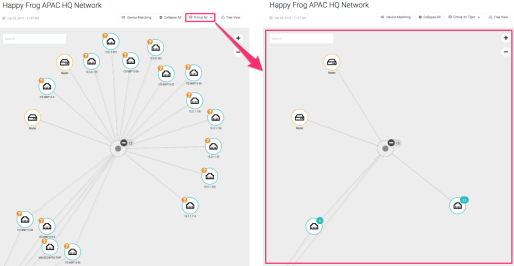
Viewing network device data
To view more details about a specific network device, click on the network device icon. Device details are displayed on the side pane.
Scenario 1: No match with IT Glue configuration
If the Network Glue Collector cannot automatically match to an existing IT Glue configuration, any information collected will be displayed in the side pane. This includes:
- Device name, type, and description
- IP address(es)
- MAC address(es)
- Web server type
- Virtualization type (Hyper-V or VMware)
- Virtual connection type (external or internal)
- Virtual status (on, off, enabled, disabled, other, shutting down, not applicable, enabled but offline, in test, deferred, quiesce, starting, or unknown)
- Port Group
- Gateway
- Operating system
- Hostname
- Device contact
- Physical location
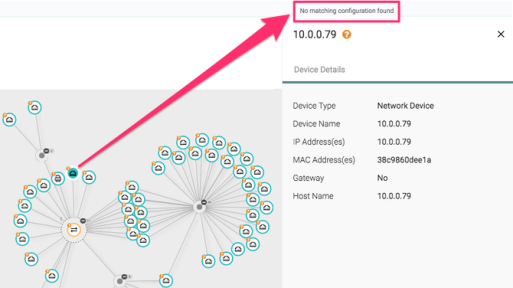
NOTE If the MAC address discovered by the Network Glue Collector matches an IT Glue configuration's primary or non-primary MAC address, an IT Glue configuration link will also be displayed on the side pane.
Scenario 2: Matched with IT Glue configuration
If the Network Glue Collector automatically matches to an existing IT Glue configuration, the side pane will show all details coming in from IT Glue, Network Glue, as well as your RMM. This allows you to see the data of a configuration in a single, consolidated view alongside the network diagram.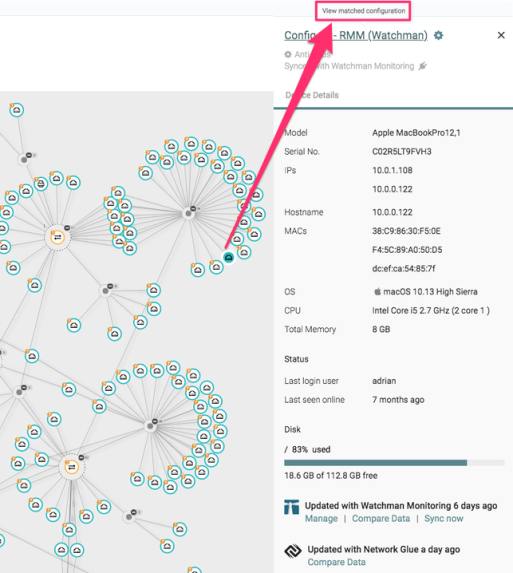
In addition to the above, a match between Network Glue and an IT Glue configuration will automatically update the device icon on the network diagram to the configuration type documented in IT Glue. This allows you to easily identify the types of devices on the diagram at a glance during troubleshooting.


